|
Eneboo - Documentación para desarrolladores
|
|
Eneboo - Documentación para desarrolladores
|
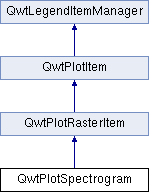
A plot item, which displays a spectrogram. Más...
#include <qwt_plot_spectrogram.h>
Clases | |
| class | PrivateData |
Tipos públicos | |
| enum | DisplayMode { ImageMode = 1, ContourMode = 2 } |
Métodos públicos | |
| QwtPlotSpectrogram (const QString &title=QString::null) | |
| virtual | ~QwtPlotSpectrogram () |
| Destructor. | |
| void | setDisplayMode (DisplayMode, bool on=true) |
| bool | testDisplayMode (DisplayMode) const |
| void | setData (const QwtRasterData &data) |
| const QwtRasterData & | data () const |
| void | setColorMap (const QwtColorMap &) |
| const QwtColorMap & | colorMap () const |
| virtual QwtDoubleRect | boundingRect () const |
| virtual QSize | rasterHint (const QwtDoubleRect &) const |
| Returns the recommended raster for a given rect. | |
| void | setDefaultContourPen (const QPen &) |
| Set the default pen for the contour lines. | |
| QPen | defaultContourPen () const |
| virtual QPen | contourPen (double level) const |
| Calculate the pen for a contour line. | |
| void | setConrecAttribute (QwtRasterData::ConrecAttribute, bool on) |
| bool | testConrecAttribute (QwtRasterData::ConrecAttribute) const |
| void | setContourLevels (const QwtValueList &) |
| QwtValueList | contourLevels () const |
| Return the levels of the contour lines. | |
| virtual int | rtti () const |
| virtual void | draw (QPainter *p, const QwtScaleMap &xMap, const QwtScaleMap &yMap, const QRect &rect) const |
| Draw the spectrogram. | |
Métodos protegidos | |
| virtual QImage | renderImage (const QwtScaleMap &xMap, const QwtScaleMap &yMap, const QwtDoubleRect &rect) const |
| Render an image from the data and color map. | |
| virtual QSize | contourRasterSize (const QwtDoubleRect &, const QRect &) const |
| Return the raster to be used by the CONREC contour algorithm. | |
| virtual QwtRasterData::ContourLines | renderContourLines (const QwtDoubleRect &rect, const QSize &raster) const |
| virtual void | drawContourLines (QPainter *p, const QwtScaleMap &xMap, const QwtScaleMap &yMap, const QwtRasterData::ContourLines &lines) const |
A plot item, which displays a spectrogram.
A spectrogram displays threedimenional data, where the 3rd dimension ( the intensity ) is displayed using colors. The colors are calculated from the values using a color map.
In ContourMode contour lines are painted for the contour levels.

The display mode controls how the raster data will be represented.
When both modes are enabled the contour lines are painted on top of the spectrogram. The default setting enables ImageMode.
| QwtPlotSpectrogram::QwtPlotSpectrogram | ( | const QString & | title = QString::null | ) | [explicit] |
Sets the following item attributes:
The z value is initialized by 8.0.
| title | Title |
| QwtPlotSpectrogram::~QwtPlotSpectrogram | ( | ) | [virtual] |
Destructor.
| QwtDoubleRect QwtPlotSpectrogram::boundingRect | ( | ) | const [virtual] |
Reimplementado de QwtPlotItem.
| const QwtColorMap & QwtPlotSpectrogram::colorMap | ( | ) | const |
| QwtValueList QwtPlotSpectrogram::contourLevels | ( | ) | const |
Return the levels of the contour lines.
The levels are sorted in increasing order.
| QPen QwtPlotSpectrogram::contourPen | ( | double | level | ) | const [virtual] |
Calculate the pen for a contour line.
The color of the pen is the color for level calculated by the color map
| level | Contour level |
| QSize QwtPlotSpectrogram::contourRasterSize | ( | const QwtDoubleRect & | area, |
| const QRect & | rect | ||
| ) | const [protected, virtual] |
Return the raster to be used by the CONREC contour algorithm.
A larger size will improve the precisision of the CONREC algorithm, but will slow down the time that is needed to calculate the lines.
The default implementation returns rect.size() / 2 bounded to data().rasterHint().
| area | Rect, where to calculate the contour lines |
| rect | Rect in pixel coordinates, where to paint the contour lines |
| const QwtRasterData & QwtPlotSpectrogram::data | ( | ) | const |
| QPen QwtPlotSpectrogram::defaultContourPen | ( | ) | const |
| void QwtPlotSpectrogram::draw | ( | QPainter * | painter, |
| const QwtScaleMap & | xMap, | ||
| const QwtScaleMap & | yMap, | ||
| const QRect & | canvasRect | ||
| ) | const [virtual] |
Draw the spectrogram.
| painter | Painter |
| xMap | Maps x-values into pixel coordinates. |
| yMap | Maps y-values into pixel coordinates. |
| canvasRect | Contents rect of the canvas in painter coordinates |
Reimplementado de QwtPlotRasterItem.
| void QwtPlotSpectrogram::drawContourLines | ( | QPainter * | painter, |
| const QwtScaleMap & | xMap, | ||
| const QwtScaleMap & | yMap, | ||
| const QwtRasterData::ContourLines & | contourLines | ||
| ) | const [protected, virtual] |
Paint the contour lines
| painter | Painter |
| xMap | Maps x-values into pixel coordinates. |
| yMap | Maps y-values into pixel coordinates. |
| contourLines | Contour lines |
| QSize QwtPlotSpectrogram::rasterHint | ( | const QwtDoubleRect & | rect | ) | const [virtual] |
Returns the recommended raster for a given rect.
F.e the raster hint is used to limit the resolution of the image that is rendered.
| rect | Rect for the raster hint |
Reimplementado de QwtPlotRasterItem.
| QwtRasterData::ContourLines QwtPlotSpectrogram::renderContourLines | ( | const QwtDoubleRect & | rect, |
| const QSize & | raster | ||
| ) | const [protected, virtual] |
Calculate contour lines
| rect | Rectangle, where to calculate the contour lines |
| raster | Raster, used by the CONREC algorithm |
| QImage QwtPlotSpectrogram::renderImage | ( | const QwtScaleMap & | xMap, |
| const QwtScaleMap & | yMap, | ||
| const QwtDoubleRect & | area | ||
| ) | const [protected, virtual] |
Render an image from the data and color map.
The area is translated into a rect of the paint device. For each pixel of this rect the intensity is mapped into a color.
| xMap | X-Scale Map |
| yMap | Y-Scale Map |
| area | Area that should be rendered in scale coordinates. |
Implementa QwtPlotRasterItem.
| int QwtPlotSpectrogram::rtti | ( | ) | const [virtual] |
Reimplementado de QwtPlotItem.
| void QwtPlotSpectrogram::setColorMap | ( | const QwtColorMap & | colorMap | ) |
Change the color map
Often it is useful to display the mapping between intensities and colors as an additional plot axis, showing a color bar.
| colorMap | Color Map |
| void QwtPlotSpectrogram::setConrecAttribute | ( | QwtRasterData::ConrecAttribute | attribute, |
| bool | on | ||
| ) |
Modify an attribute of the CONREC algorithm, used to calculate the contour lines.
| attribute | CONREC attribute |
| on | On/Off |
| void QwtPlotSpectrogram::setContourLevels | ( | const QwtValueList & | levels | ) |
Set the levels of the contour lines
| levels | Values of the contour levels |
| void QwtPlotSpectrogram::setData | ( | const QwtRasterData & | data | ) |
| void QwtPlotSpectrogram::setDefaultContourPen | ( | const QPen & | pen | ) |
Set the default pen for the contour lines.
If the spectrogram has a valid default contour pen a contour line is painted using the default contour pen. Otherwise (pen.style() == Qt::NoPen) the pen is calculated for each contour level using contourPen().
| void QwtPlotSpectrogram::setDisplayMode | ( | DisplayMode | mode, |
| bool | on = true |
||
| ) |
The display mode controls how the raster data will be represented.
| mode | Display mode |
| on | On/Off |
The default setting enables ImageMode.
| bool QwtPlotSpectrogram::testConrecAttribute | ( | QwtRasterData::ConrecAttribute | attribute | ) | const |
Test an attribute of the CONREC algorithm, used to calculate the contour lines.
| attribute | CONREC attribute |
| bool QwtPlotSpectrogram::testDisplayMode | ( | DisplayMode | mode | ) | const |
The display mode controls how the raster data will be represented.
| mode | Display mode |
 1.7.4
1.7.4

